AIG Is The Best Insurance Play For 2013
Introduction
AIG is an insurance conglomerate that spans the globe, but during the great recession like many other giant financial institutions, AIG got itself into a lot of trouble taking on the counter-party risk of mortgage backed securities. During the 4th quarter of 2008, AIG set the world record for reporting the biggest loss. It lost $99.3 billion dollars in a single quarter.
Despite the hazy past, AIG is the definition of a turnaround story. I anticipate the company to generate outstanding earnings growth going forward, and that investors will be able to earn some phenomenal yields by investing into AIG.
Qualitative Analysis
Source: Information pertaining to AIG came from the shareholder annual report
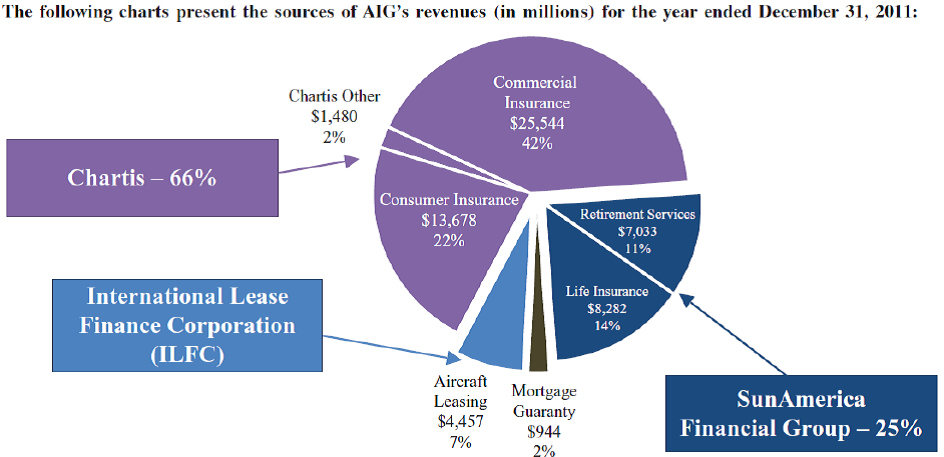
The company currently operates one of the largest insurance networks in the world, with more than 85 million clients in 130 countries. AIG is split into four business divisions: Chartis, SunAmerica Financial Group, Aircraft Leasing, and other operations.
Chartis offers a unique portfolio of insurance products and services. The insurance products are: casualty, property, financial lines, and specialty. Chartis conducts its business through multiple entities such as: New Hampshire Insurance Company, American Home Assurance Company, Lexington Insurance Company, AIU Insurance Company, Chartis Overseas, Fuji Fire & Marine Insurance Company Limited, Chartis Europe Holdings Limited, and Chartis Europe.
SunAmerica Financial Group – offers a comprehensive suite of products such as: term life, universal life, fixed/variable annuities, mutual funds, financial planning. The SunAmerica Financial Group operates under these subsidiaries: American General Life Companies (American General), Variable Annuity Life Insurance Company (Western National), SunAmerica Retirement Markets (SARM).
AIG’s other operations primarily consisted of derivatives trading, and aircraft leasing. The other operations: International Lease Finance Corporation, AIG Markets, United Guaranty Corporation, AIG Financial Products, and AIG Trading Group Inc.
Currently AIG generates 91% of its revenue through the SunAmerica Financial Group, and Chartis.

AIG’s current management strategy remains simple: by 2015 achieve return on equity above 10%, generate share growth in mid-teens, grow insurance divisions, and reinvest retained earnings.
AIG aggressively competes with Berkshire Hathaway (BRK.A/BRK.B), The Travelers Companies (TRV), Chubb (CB), Allstate (ALL), Loews (L), Progressive (PGR), Hartford Financial Services (HIG), CNA Financial (CNA), among many others.
Technical Analysis
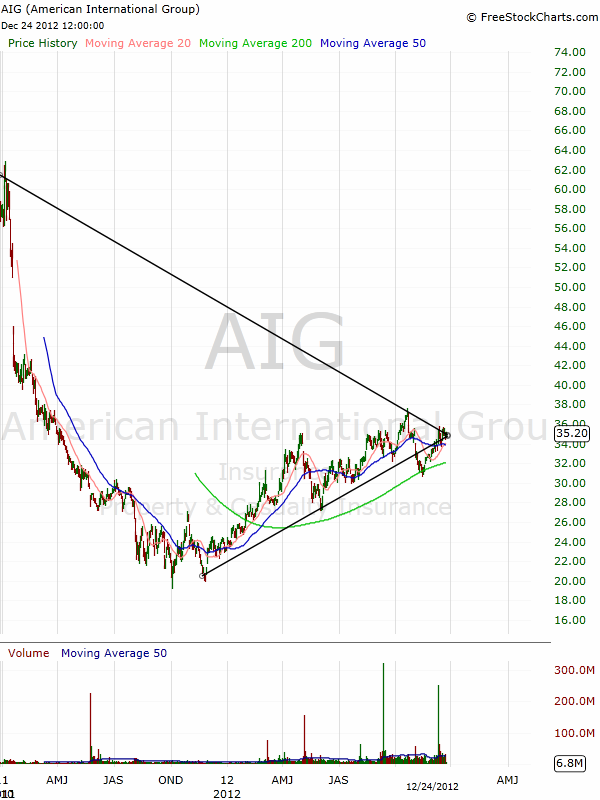
The stock has been on a continuous up-trend since November 2012. On 12/24/2012 the stock is between a very narrow symmetrical triangle formation. I anticipate the stock to break out no later than the 26th or 27th, meaning that the stock will be forced to make a major move.

Source: Chart from freestockcharts.com
The stock is trading above the 20-, 50-, and 200- Day Moving Averages. The stock will experience further upside through 2013, as investors have under-bought the growth prospects of the company.
Notable support is $23.00, $27.30, and $30.60 per share.
Notable resistance is $37.50, $46.00, and $60.00 per share.
Street Assessment
Analysts on a consensus basis have high expectations for the company going forward.
| Growth Est | AIG | Industry | Sector | S&P 500 |
| Current Qtr. | -113.40% | -99.90% | -93.80% | 9.50% |
| Next Qtr. | -48.50% | -99.80% | -92.70% | 15.30% |
| This Year | 266.70% | 99.80% | 23.30% | 7.20% |
| Next Year | -6.70% | 20.80% | 6.90% | 13.10% |
| Past 5 Years (per annum) | -42.91% | N/A | N/A | N/A |
| Next 5 Years (per annum) | 21.93% | 13.20% | 10.60% | 8.72% |
| Price/Earnings (avg. for comparison categories) | 9.41 | 19.56 | 13.83 | 14.69 |
| PEG Ratio (avg. for comparison categories) | 0.43 | 1.67 | 0.95 | 1.41 |
Source: Table and data from Yahoo Finance
Analysts have high expectations, as analysts on a consensus basis have a 5-year average growth rate forecast of 21.93% (based on the above table). This growth rate is above the industry average for next 5-years (13.20%).
| Earnings History | 11-Dec | 12-Mar | 12-Jun | 12-Sep |
| EPS Est | 0.63 | 1.12 | 0.57 | 0.86 |
| EPS Actual | 0.82 | 1.65 | 1.06 | 1 |
| Difference | 0.19 | 0.53 | 0.49 | 0.14 |
| Surprise % | 30.20% | 47.30% | 86.00% | 16.30% |
Source: Table and data from Yahoo Finance
The average surprise percentage is 44% above analyst forecast earnings over the past four quarters (based on the above table).
Forecast and History
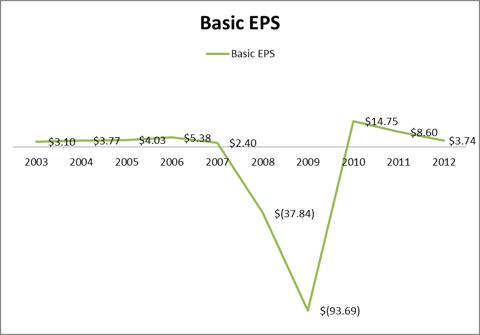
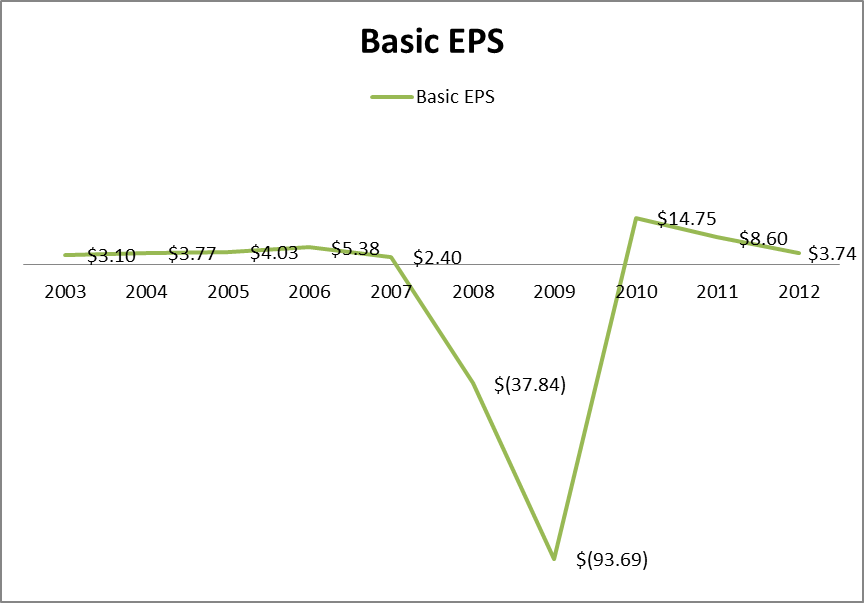
| Year | Basic EPS | P/E Multiple |
| 2003 | $ 3.10 | 21.38 |
| 2004 | $ 3.77 | 17.42 |
| 2005 | $ 4.03 | 16.93 |
| 2006 | $ 5.38 | 13.32 |
| 2007 | $ 2.40 | 24.29 |
| 2008 | $ (37.84) | – |
| 2009 | $ (93.69) | – |
| 2010 | $ 14.75 | 3.27 |
| 2011 | $ 8.60 | 2.7 |
| 2012 | $ 3.74 | 9.41 |
Source: Table created by Alex Cho, data from shareholder annual report
The EPS figure shows that throughout the 2003-2006 period earnings were growing due to favorable economic conditions. Then the company was adversely affected by the great recession throughout 2007-2009, as the net income rapidly declined, and AIG eventually logged the biggest loss in corporate history. During 2010 the company was able to generate a profit by restructuring the company; this involved selling business units, which inflated earnings by $17.7 billion dollars. Once the United States economy exited the recession in 2010-2012 the company earnings have improved, albeit gradually. In 2011 the abnormal earnings of $8.60 were due to a provisional benefit from taxes worth $18.03 billion dollars. The improvements in net income for 2010-2011 were one-time events and should not be considered a part of the long-term earnings growth trend. So in essence, 2012 is likely to be the most normal year for AIG over the past 5 years.
Source: Table created by Alex Cho, data from shareholder annual report
By observing the chart we can conclude that the business is somewhat cyclical and is affected by macroeconomics. Therefore one of the largest risk factors to AIG is the slowing of international gross domestic product growth. So as long as the global economy continues to grow, the company will generate reasonable returns over a 5-year time span based on the forecast below.

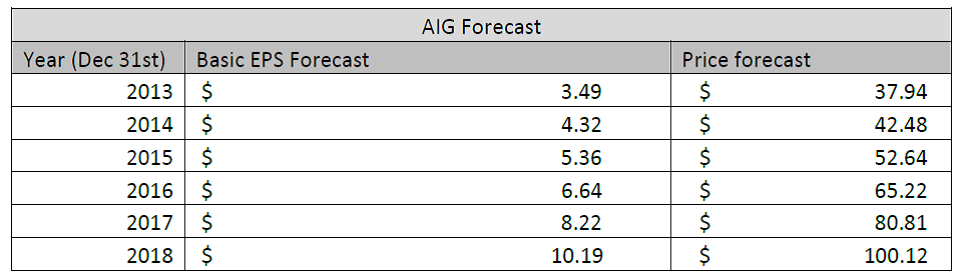
Source: Forecast and table by Alex Cho
By 2018 I anticipate the company to generate $10.19 in earnings per share. This is because of earnings growth, improving global outlook, earnings management and continued development overseas.
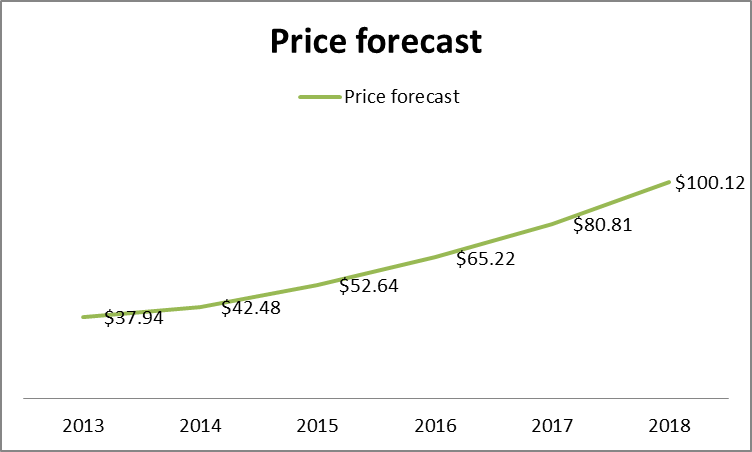
The forecast is proprietary, and below is a non-linear chart indicating the price of the stock over the next 5-years.
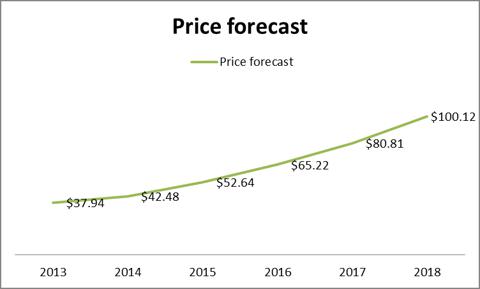
Source: Forecast and chart by Alex Cho
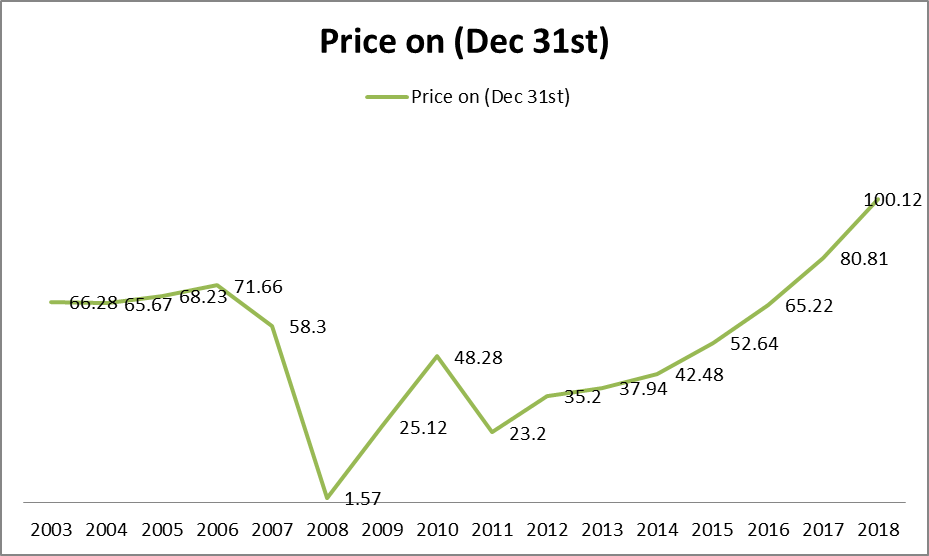
Below is a price chart incorporating the past 10 years and the next 6 years. Detailing 16 years in pricing based on my forecast and price history on December 31st of each year.

Source: Forecast and chart created by Alex Cho, data from shareholder annual report, and price history is from Yahoo Finance.
*The period 2003-2008 were price quotes based on pre-split stock prices (multiply by 20 to accurately calculate the price of the shares between 2003 and 2008). On 7/01/2009 the stock had a 1:20 split (reverse split).
Investment Strategy
AIG currently trades at $35.20. I have a price forecast of $37.94 for 2013. AIG is in a long-term up-trend. I anticipate momentum in the price of the stock, as the growth rate offers compelling stock appreciation for the foreseeable future.
Short Term
Over the next twelve months, the stock is likely to appreciate from $35.20 to $38.60 per share. This implies 9.6% upside from current levels. The technical analysis indicates an up-trend (break above the symmetrical triangle formation). While the previously mentioned price forecast using fundamental analysis further supports the trade set-up.
Investors should buy AIG at $35.20 and sell at $38.60 to pocket short-term gains of 9.6% in 2013. This return is pretty measly, meaning that short-term investors would likely do better investing in other opportunities.
Long Term
The company is a great investment for the long-term. I anticipate AIG to deliver upon the price and earnings forecast despite the risk factors (macroeconomic, competition, etc.). AIG’s primary upside catalyst is international development, and earnings management. I anticipate the company to deliver upon my forecasted price target of $100.12 by 2018. This implies a return of 185% by 2018. This rate of return is exceptional, considering AIG has a market capitalization of $52B. The extra liquidity makes this a compelling growth investment for institutional investors who require higher liquidity.
Conclusion
Buy AIG on long-term growth. AIG has not died off the surface of the earth; it is more stubborn than a roach.
The conclusion remains simple: buy AIG.
Retrived From: http://seekingalpha.com/article/1082001-aig-is-the-best-insurance-play-for-2013?source=email_investing_ideas&ifp=0
Posted on December 28, 2012, in Latest Articles!!!. Bookmark the permalink. Leave a comment.

Leave a comment
Comments 0